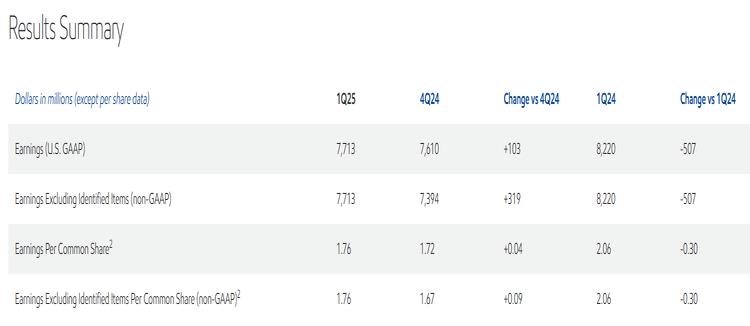
Exxon Mobil Corporation has announced first-quarter 2025 earnings of $7.7 billion, or $1.76 per share assuming dilution. Cash flow from operating activities was $13.0 billion and free cash flow was $8.8 billion. Shareholder distributions of $9.1 billion included $4.3 billion of dividends and $4.8 billion of share repurchases, consistent with the company's announced plans.
- Execution of the company's strategy drove both industry-leading earnings of $7.7 billion and cash flow from operations of $13.0 billion(1)
- Three-year total shareholder return CAGR of 17% lead industry and large industrials(1)
- Distributed industry-leading $9.1 billion in shareholder distributions including $4.3 billion in dividends(1)
- Commenced operations at the China Chemical Complex and 2nd Advanced Recycling Unit in Baytown
'In this uncertain market, our shareholders can be confident in knowing that we're built for this. The work we've done to transform our company over the past eight years positions us to excel in any environment,' said Darren Woods, chairman and chief executive officer.
'In the first quarter, we earned $7.7 billion and generated $13.0 billion in cash flow from operations. Since 2019, the strategic choices we made to reduce costs, grow advantaged volumes, and optimize our operations have strengthened quarterly earnings power by about $4 billion at current prices and margins.(3) This year, we're starting up 10 advantaged projects that are expected to generate more than $3 billion of earnings in 2026 at constant prices and margins.(4) Continuously leveraging our competitive advantage is enabling the company to excel in the current market environment and deliver on our plans through 2030 and far into the future.'
1 Earnings, cash flow from operations and shareholder distributions for the IOCs are actuals for companies that reported results on or before April 30, 2025, or estimated using Factset consensus as of April 30. IOCs includes each of BP, Chevron, Shell and TotalEnergies. Total shareholder return CAGR compares to each IOC and the average of large-cap S&P industrials as of March 31. Large-cap S&P industrials refer to companies in the S&P Industrials sector with market capitalization >$75 billion as of December 31, 2024.
2 Assuming dilution.
3 Current prices and margins refers to $65/bbl Brent, $3/mmbtu Henry Hub, $12/mmbtu TTF, and average Energy, Chemical, and Specialty Products margins for April 2025, which approximate prices and margins in April 2025.
4 Earnings contributions are adjusted to 2024 $65/bbl real Brent (assumes annual inflation of 2.5%) and 10-year average Energy, Chemical, and Specialty Product margins, which refer to the average of annual margins from 2010-2019.
Click here for full announcement
Source: ExxonMobil