
Understanding and quantifying uncertainty remains a persistent challenge to making effective geoscience decisions. Whether evaluating hydrocarbon reservoirs, assessing carbon storage potential, planning geothermal developments, or modelling groundwater systems, subsurface professionals can’t avoid the problems of incomplete, ambiguous, and often conflicting information. This article explores some of the challenges and the practical solutions that can be put in place to improve subsurface predictions by incorporating uncertainty analysis.
Treating Uncertainty as an Afterthought
Presenting a single best case model often leads to unrealistic confidence levels in interpretation outputs as they are taken as definitive. By integrating uncertainty from the outset, workflows can be designed to consider the validity of all available data and consider alternative interpretations.
Overreliance on a Single Data Type
Geoscientists often give undue weight to the dataset they understand best. Seismic interpreters will be drawn to seismic data whereas petrophysicists will look to logs. This single-discipline bias can produce deceptively convincing models that ignore conflicting evidence. Merlin’s integrated project teams use multi-disciplinary workflows ensuring individual subject matter excellence is combined into one robust, cohesive interpretation.
Misinterpreting Geophysical Data Resolution
Seismic data is powerful but imperfect. Interpreters can mistake processing artefacts for geological features, ignore tuning effects, or assume resolution is uniform across an area. These misconceptions can lead to mapping false structural closures, misplacing faults, or calculating incorrect reservoir thicknesses.
Before initiating any geophysical interpretation workflows, it is key to understand seismic resolution limits; vertical, horizontal or frequency dependent. At the start of any seismic project, Merlin focuses on recognising the resolution afforded by the dataset in question and how this could vary spatially or with depth. Well to seismic ties provide one way of gaining quantitative insight into seismic resolution, which can be used to assess the uncertainty on correlating seismic reflectors to geological formations.
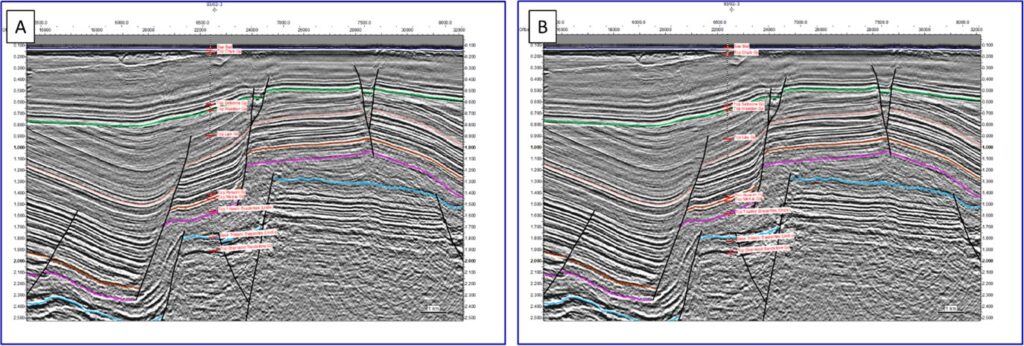
(A) Well displayed on seismic using a time-depth relationship directly from pseudo-checkshots; (B) Well displayed on seismic using a time-depth relationship created initially from pseudo-checkshots but with stretch/squeeze pairs interpreted to ensure a good correlation between synthetic and seismic. Note how the formation top labels are in different places in images (A) and (B), particularly in the deeper part of the well.
Underestimating Geological Complexity
Nature never conforms to simplified conceptual models. Over-smooth stratigraphic interpretations, simple fault geometries and unrealistic depositional models can give a false sense of certainty. Well data provides a pinpoint insight into the subsurface and yet often limited well datasets are automatically assumed to represent a mid-case interpretation. Placing well data into a more regional structural and depositional model aids understanding of other potential interpretation scenarios. It is easy to forget that no model will ever be 100% accurate, but they can be the best representation possible of the available data.
While it is important to capture the complexity of the geology, computing limits for dynamic simulations can unfortunately restrict what is practical to include. Geologists need to ensure that a happy middle ground is reached between complexity and run time. By having a good understanding of all input data, geologists can ensure that key risks are appropriately modelled to capture and understand varying geological complexities. It could be that one small, overlooked variable could be the difference between a history match or not. For example, following a mismatch between geological interpretation and engineering observations, Merlin identified that fine scale variabilities in dune architecture of tight Rotliegend sandstones in the SNS provided the required migration pathways to match observed gas production histories.
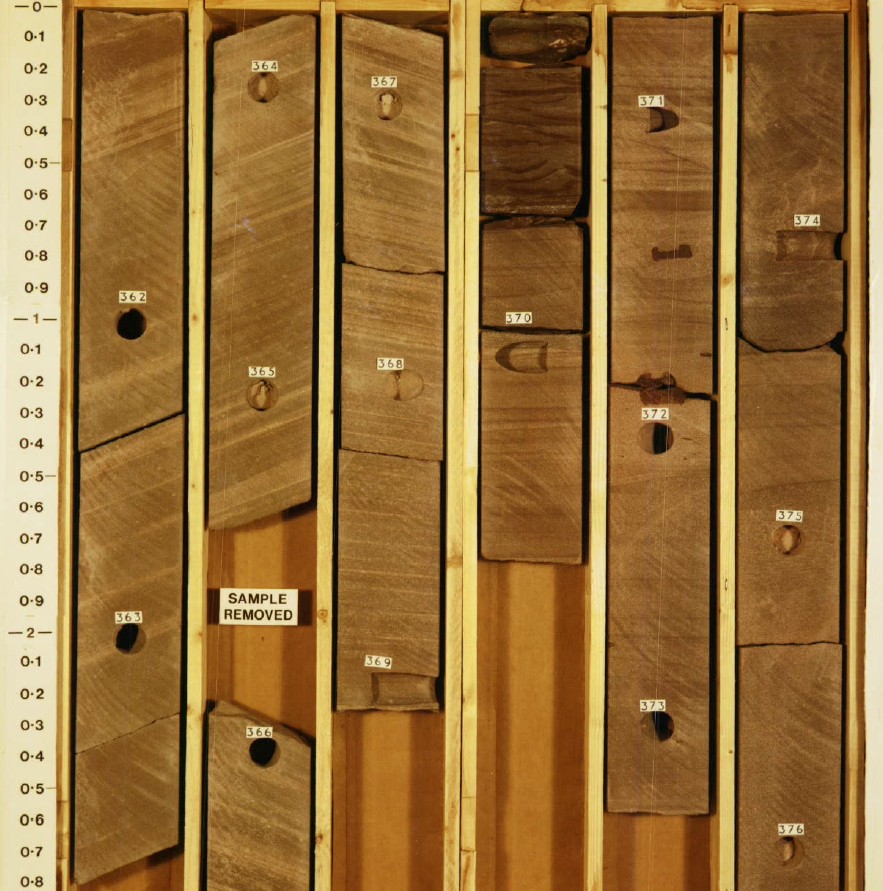
In some cases, it can be core scale variability which makes the difference between a history match or not, showing how important it is to understand all the geological complexities.
Overconfidence in Numerical Precision
There are many examples of overconfidence in numerical position. For example, just because a depth converted grid ties to the well formation tops to three decimal places, does not mean it will be correct away from those well locations.
Similarly, we use geoscience software to build beautifully detailed models, but fine-scale grid cells or complex inversions can mask the fact that the underlying datasets are full of uncertainty. By integrating uncertainty into workflows, models can be built to represent the actual data constraints. For example, a coarser grained model resolution will be more appropriate for early exploration phases, while in re-development scenarios, where there is significantly more data available, detail is appropriate to capture observed results. It may be necessary to generate multiple models to investigate different interpretation scenarios and evaluate potential outcomes. By pushing focus onto range-based outcomes from the outset, appropriate uncertainty can be better evaluated.
Conclusion
Subsurface evaluations by their nature are imperfect. It is important that subsurface professionals acknowledge the full extent of that uncertainty. It is OK not to have the complete answer – it is, after all, an interpretation. Understanding uncertainties and taking steps to quantify their impact allows you to design future data acquisition and/or workflows to reduce those uncertainties and improve the resulting interpretation.
Handling geological and geophysical uncertainties is inherently challenging, but many pitfalls arise from workflow choices rather than data limitations. By embracing variability, integrating disciplines, grounding models in geological realism, and communicating uncertainty transparently, geoscientists are able to deliver more reliable predictions to better support decision-making.
One Final Observation
The importance of how uncertainty is communicated with non-specialist stakeholders should not be underestimated. Uncertainty ranges may be taken as indecision, or conversely as overly simplified predictions, and therefore can be undervalued by management. Using visual storytelling along with highlighting the drivers of uncertainty can help to provide a clearer message which can be understood by all stakeholders.
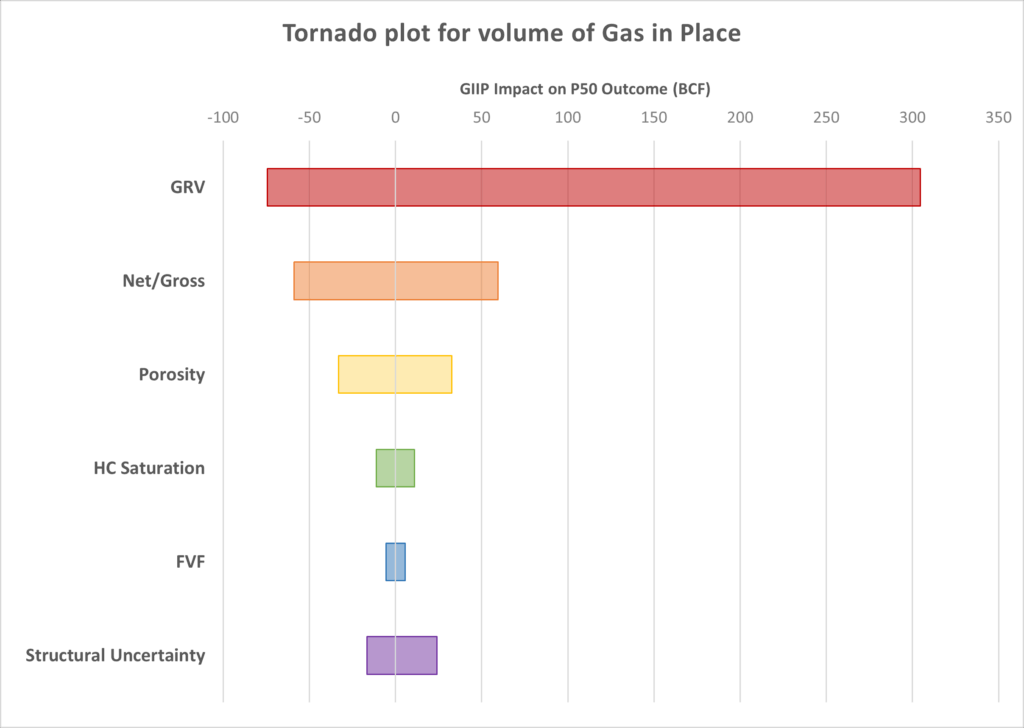
A tornado plot can be an easy visual way to display and compare uncertainty ranges for a number of parameters.
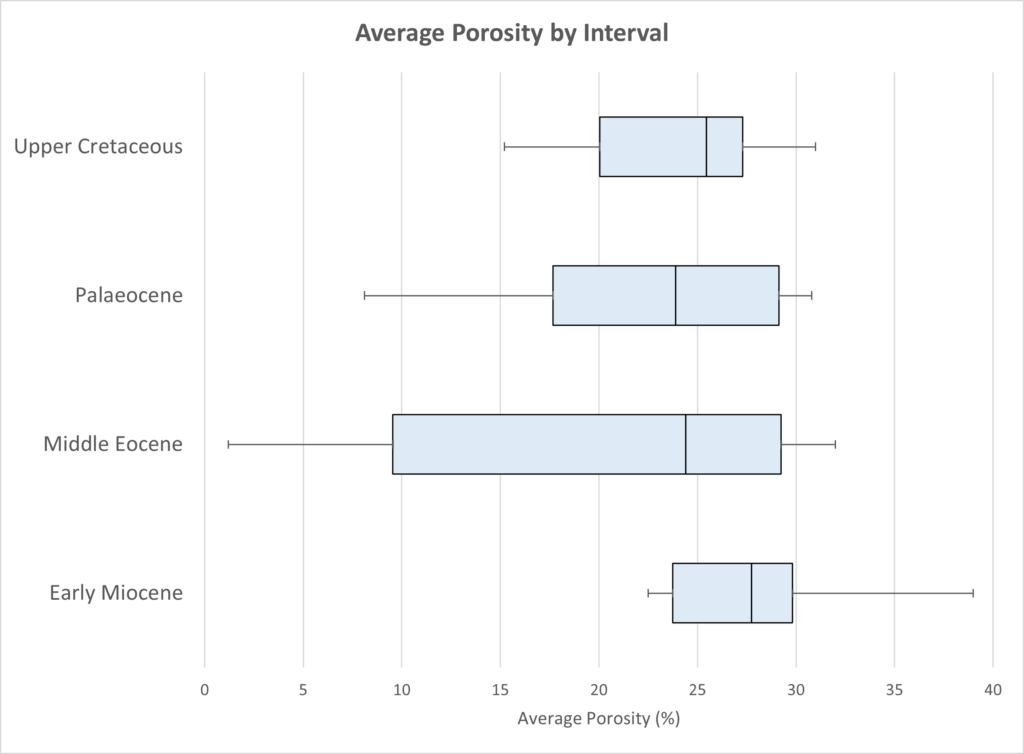
A box plot is a graphical representation of a dataset’s distribution highlighting the data’s central tendency as well as its spread and variability.
Uncertainty is not something to minimise or ignore, it is essential information. When properly understood and communicated, it becomes a vital strategic asset. If Merlin can help capture uncertainty in your project, please get in touch.
Source: Merlin Energy